Color
Video Scopes
11 minute read
Scopes break down all the pixels of an image into luma and/or chroma information and then visualize it so it can be easily read. This visualization is called a Trace. Depending on the function of a scope, the trace will represent different aspects of an image and be displayed in various ways.
There are three general ways to trace a video signal on a scope–with a Waveform, Histogram, or Vector Scope. Within each of these categories there are numerous configurations, with over a dozen different scopes to choose from (depending on how you count). Thankfully, there are only a few primary video scopes that you are likely to need for your project.
Waveform Scopes
Waveforms are often the first scope you’ll use in the color correction process. They graph the visual information of an image onto x and y axes, with the vertical axis measuring values (of the scope), and the horizontal axis representing position (in the image).
The most common waveform is the Luma Waveform. As the name implies, it measures the brightness of an image.

Luma waveforms measure the pixels of an image from dark to light (bottom to top). Bright pixels of the image are plotted higher in the waveform, and dark pixels are plotted lower. These brightness values are then arranged based on their actual horizontal position in the frame (left to right). So the furthest left part of the waveform is the furthest left part of the image. The same is true for the furthest right part, the middle, and every other horizontal position in the image. In short, left is left, and right is right.
But up is not up, and down is not down. Remember, the vertical axis only measures brightness. So then how do we read it, exactly?
When the waveform traces the image, it’s actually looking at 1-pixel-wide vertical slices. The pixels in every vertical slice are arranged vertically based on brightness. So a bright pixel at the bottom of an image will appear at the top of the waveform. To read this scope, look for the brightest peak in the image, and then try to find which part of the image it corresponds to (usually the purest white on screen).
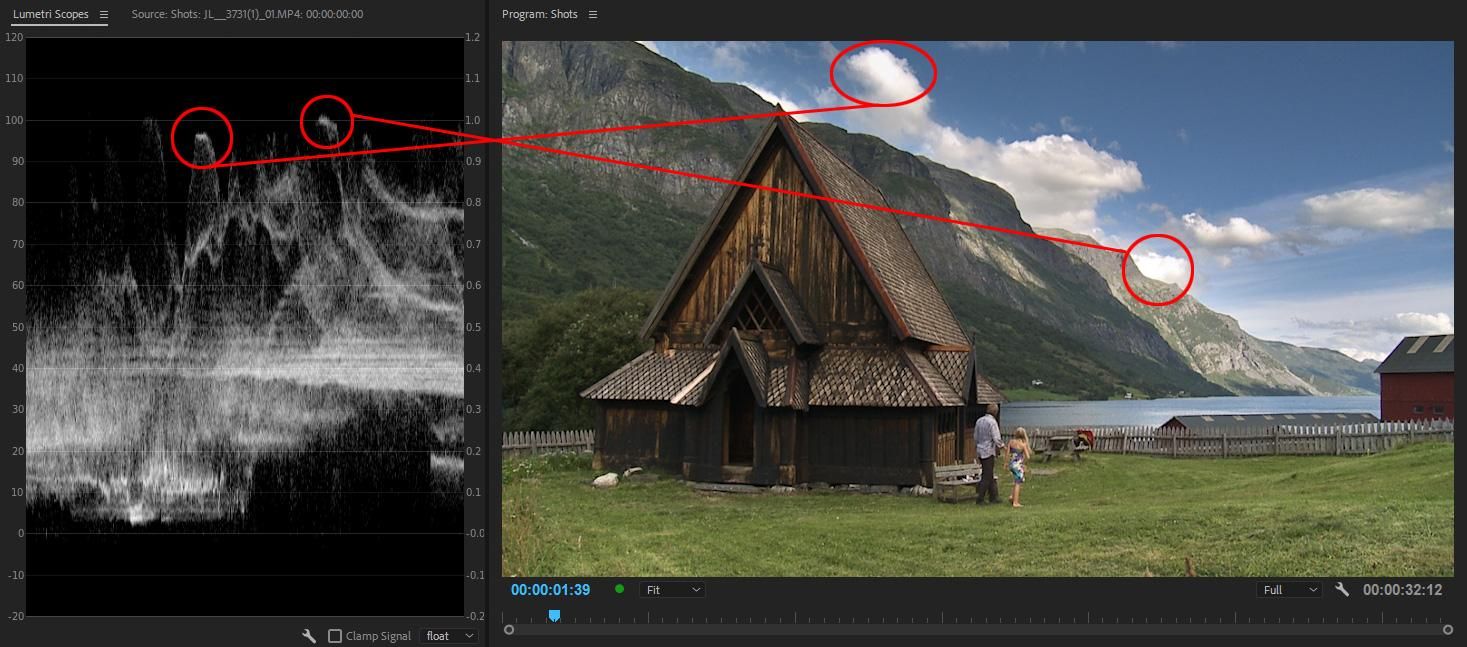
Note how the position of the spikes in the waveform mirror the position of the brightest pixels.
Here we’ve circled the corresponding areas in the scope and the shot. Now you can clearly see that the brightest peaks on the waveform are located at the same horizontal position as the clouds in the shot (roughly the middle).
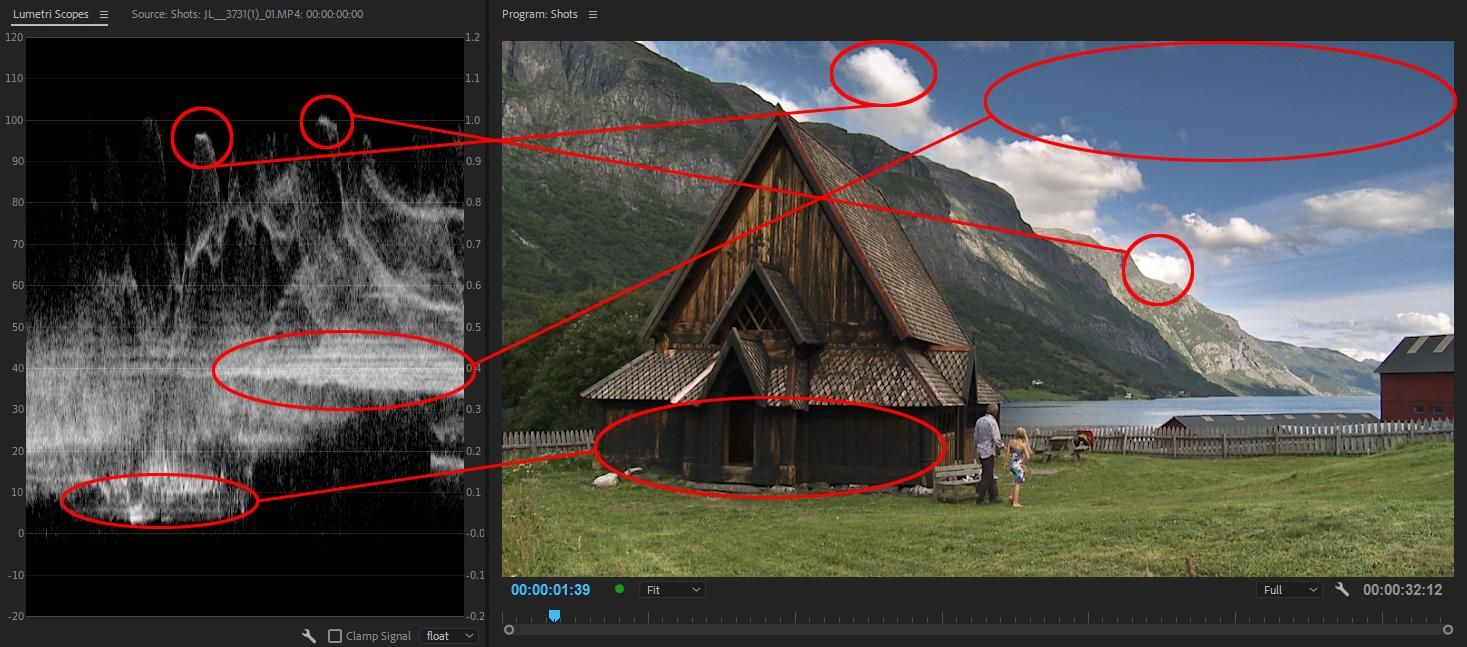
The area with lots of dark pixels on the left is the dark wall of the church. The area with lots of midtone pixels to the right is the blue sky (and probably parts of the green grass below).
And here we can see the darkest parts of the image (the front of the church) are at the same horizontal position as the lowest part of the waveform trace (in the left/middle of the frame). The big patch of open sky in the upper right of the frame is neither super bright or super dark, and so it’s fits squarely in the midtones, which mirrors the waveform trace.
It can take some practice to read waveforms quickly, but you start to manipulate an image and see the scope update in real time, it will make a lot more sense. Here are some other images that show how the distribution of light and dark pixels from left to right is mirrored in the waveform scope.
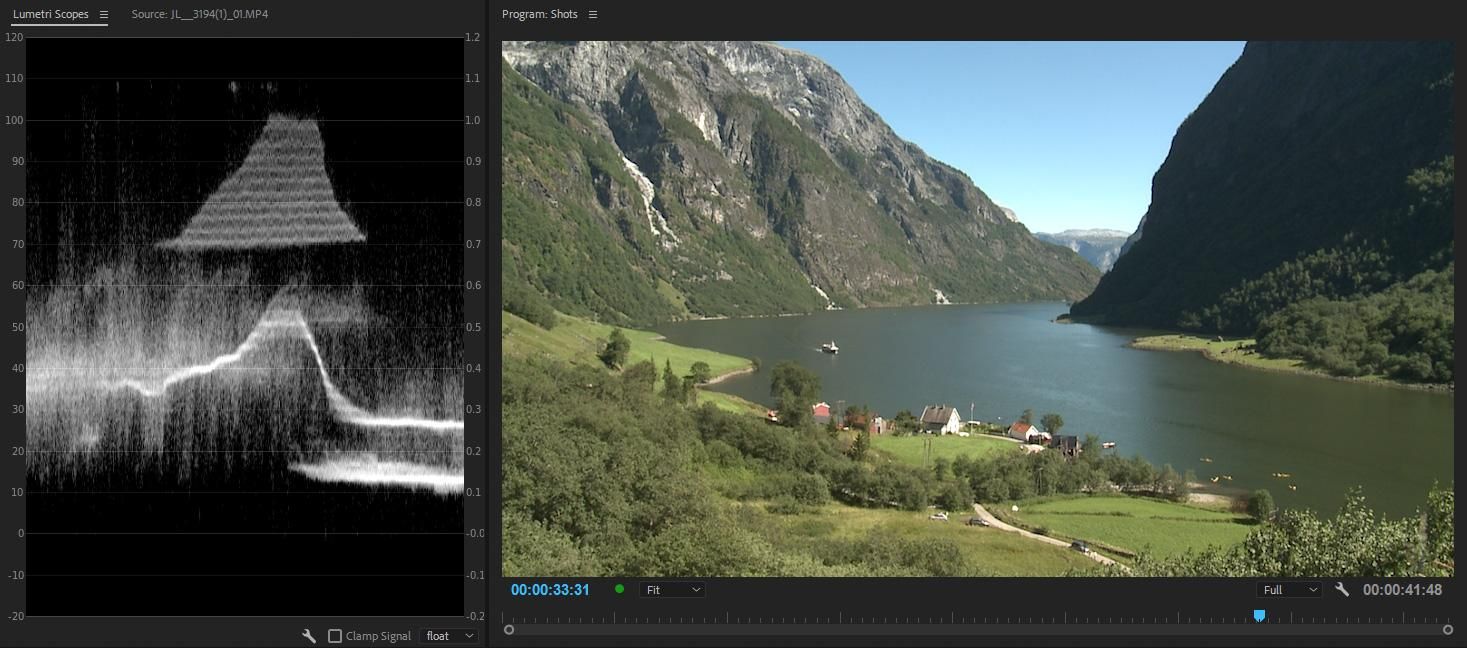
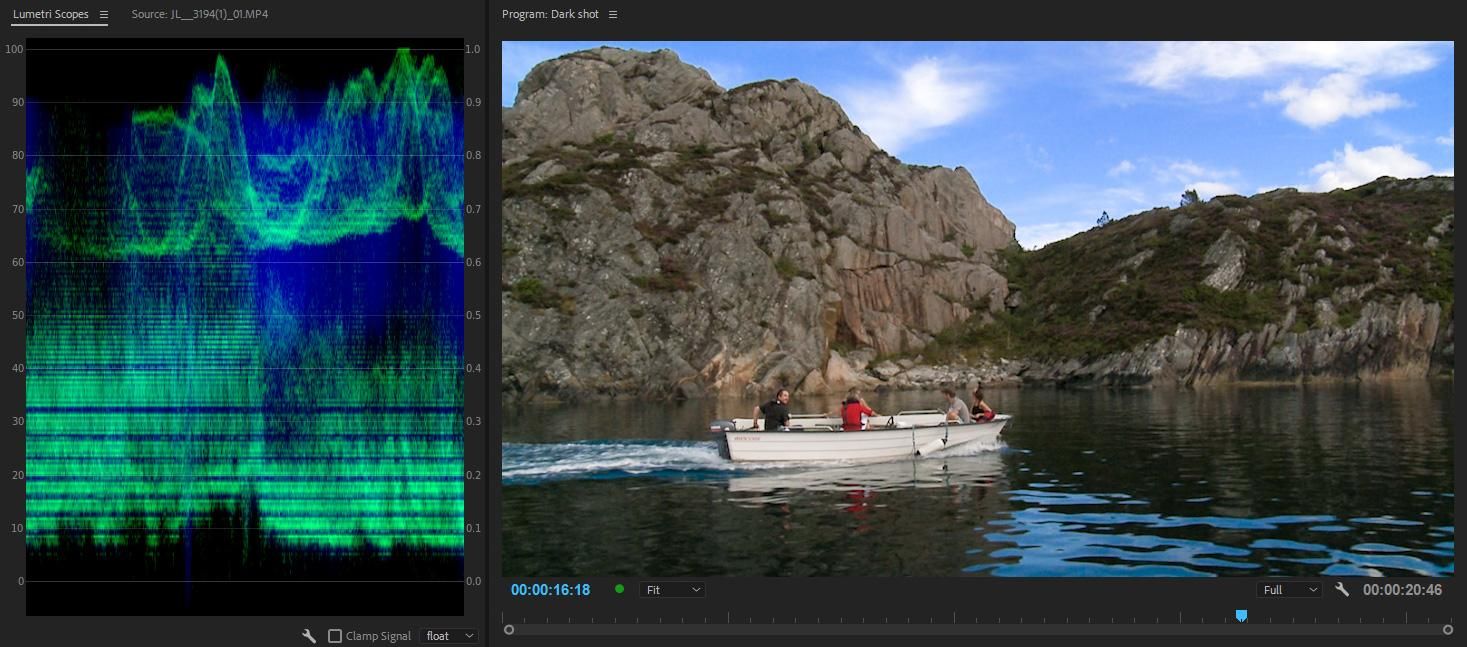
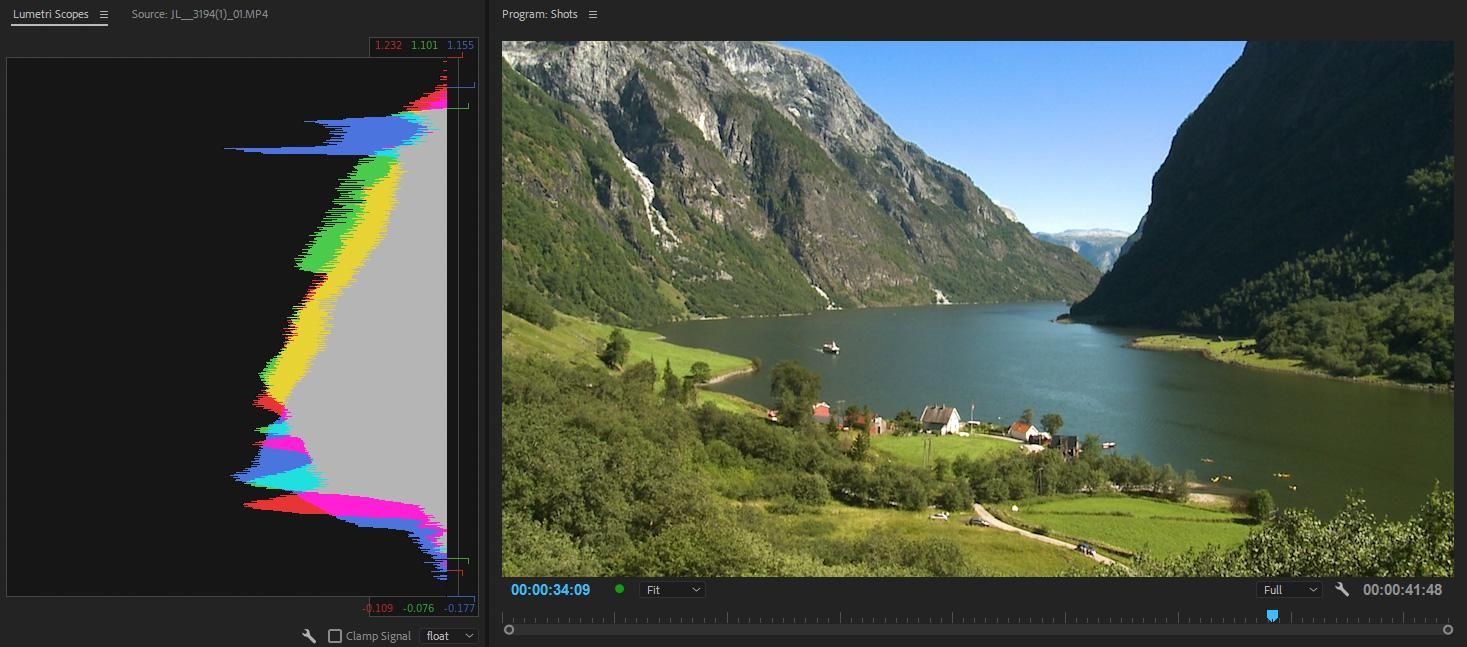
Scope shows lots of dark pixels on the right, some bright pixels in the middle, and mainly midtones on the left side.
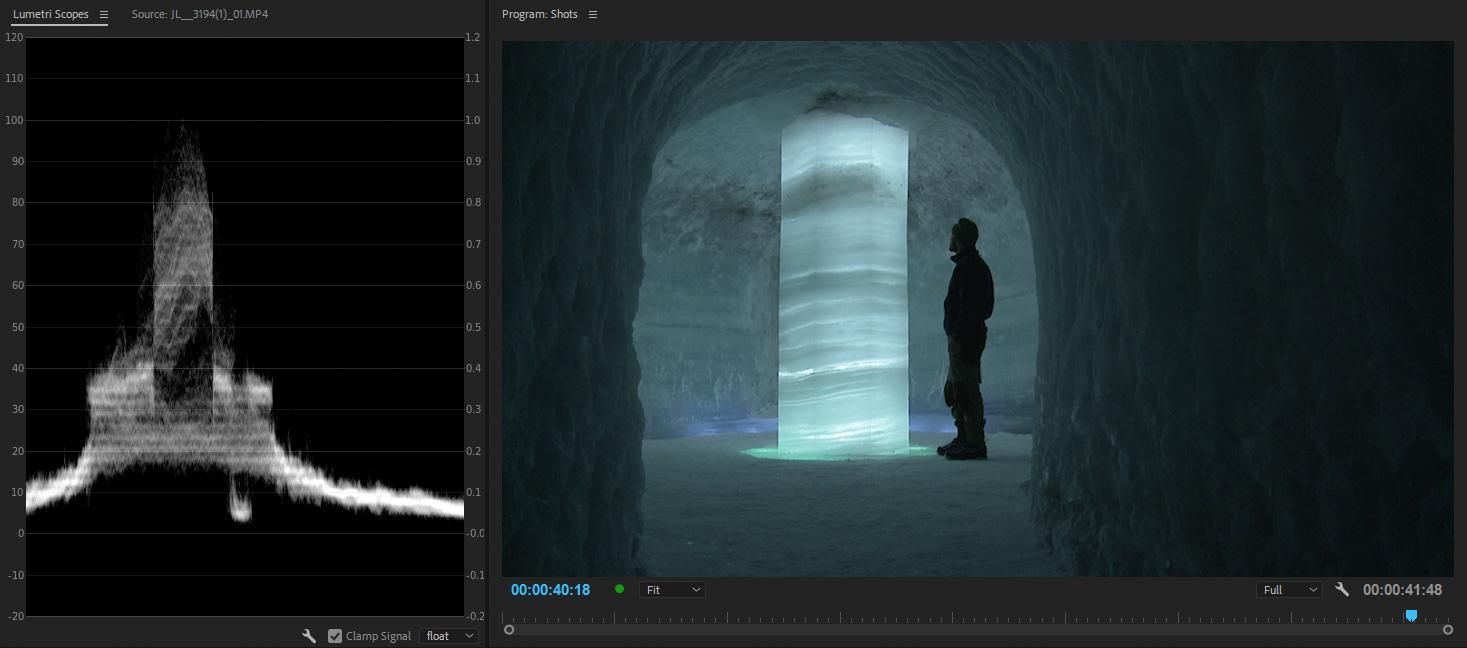
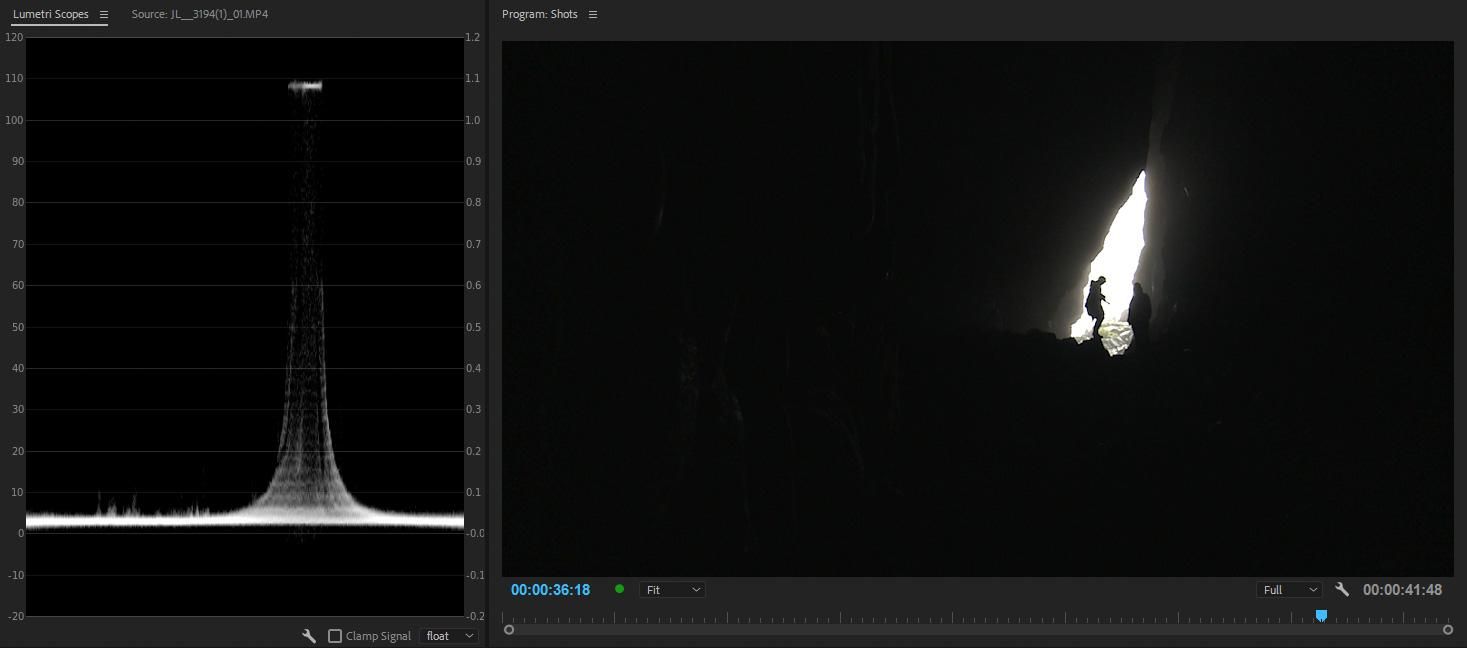
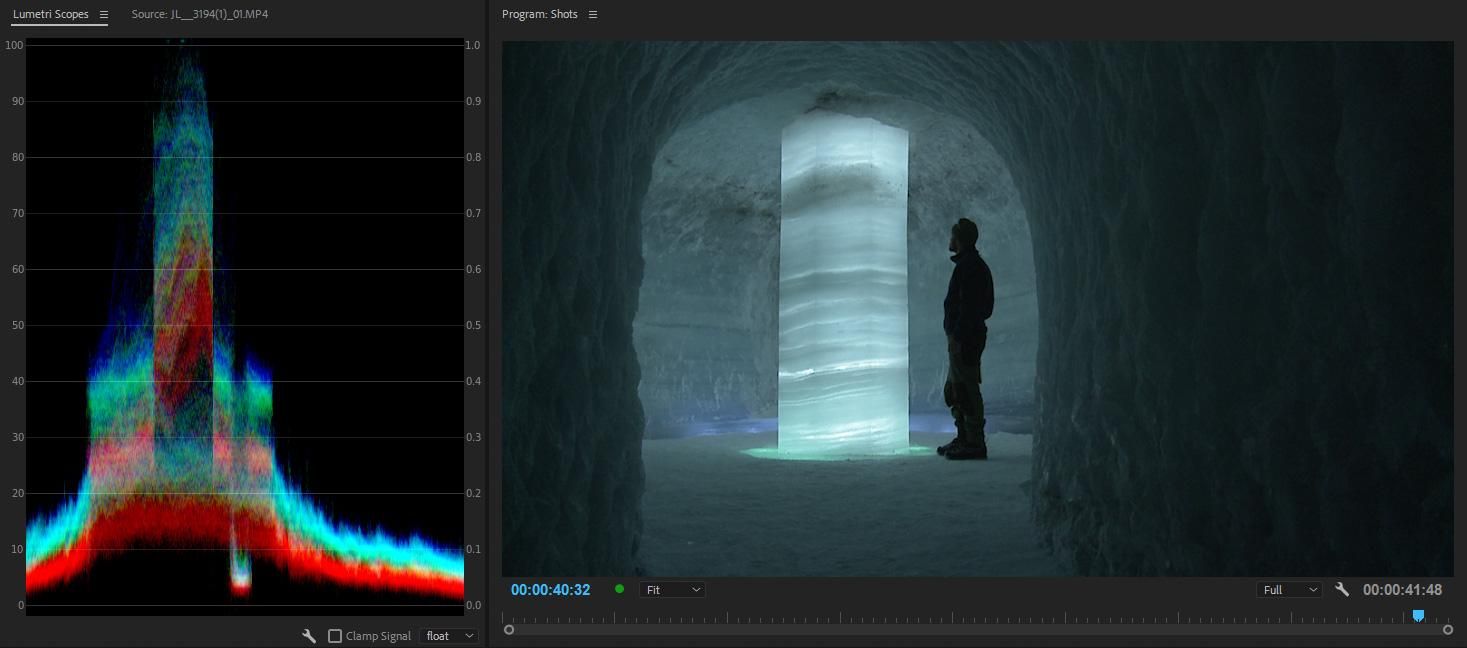
Scope shows dark pixels on both sides, some midtones in the middle, and a narrow area of bright pixels a bit to the left of the middle. Can you spot the man’s dark silhouette on the scope?
Scope shows lots of black or near black pixels across the whole image, and a small area of very bright pixels a bit to the right of the middle.
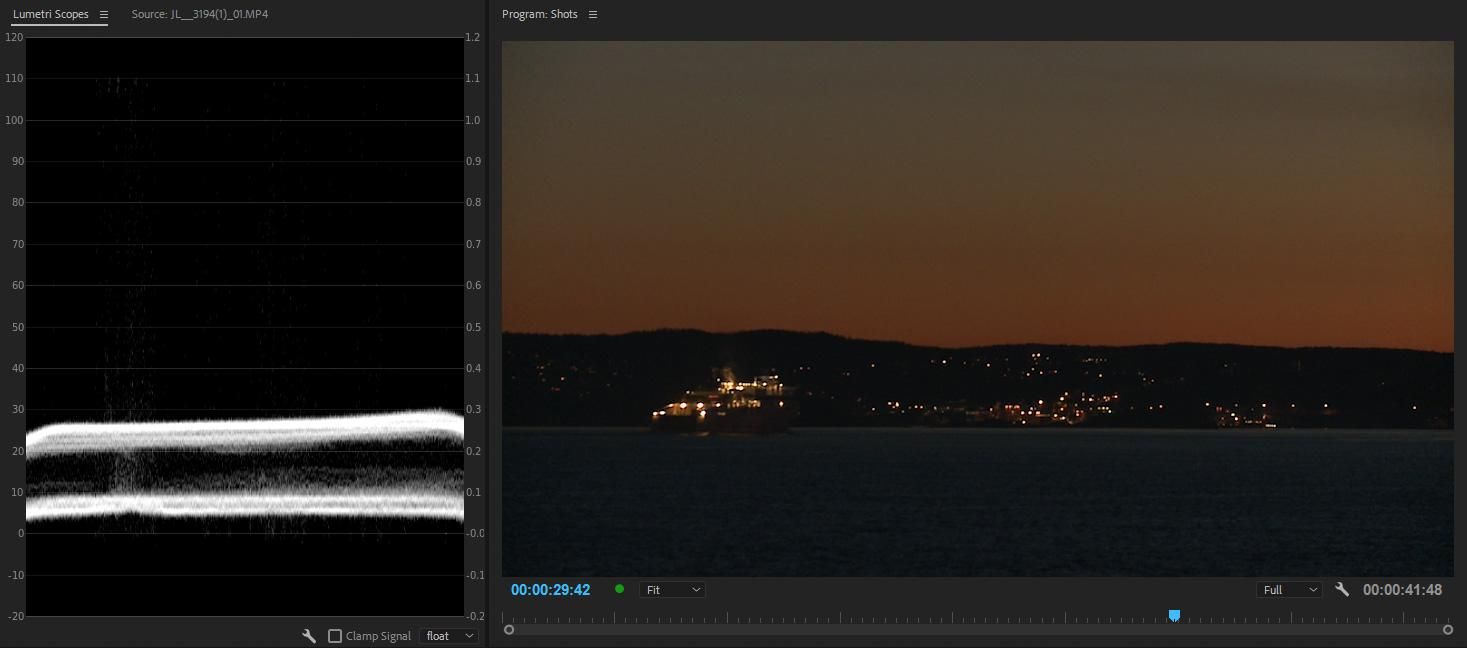
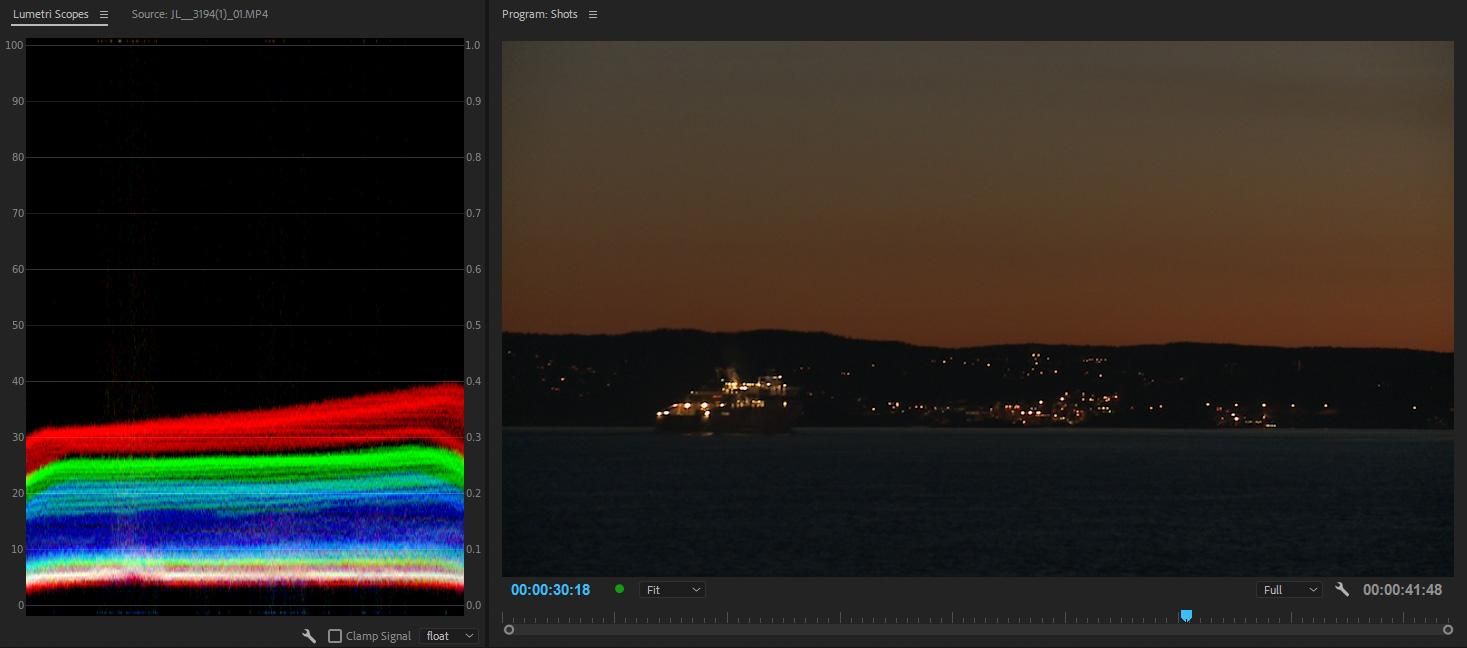
Scope shows very dark pixels across the whole image, and some brighter, but still pretty dark, pixels, also across the whole image.
As you can probably guess, the Luma Waveform is an excellent tool for checking the exposure of your footage. The numbers on the scale are measurements of brightness for particular video standards. In this case, it’s for HD video signals, where absolute black is 0 and white is 100. Any part of the signal that falls below 0 will be clipped, as will any level above 100. If you’re color correcting your project for broadcast, keep your levels within the 0-100 range.
[Note: This is true only for Standard Dynamic Range (SDR) video. Newer Ultra-HD standards have introduced High Dynamic Range (HDR) capabilities, where whites can go all the way to 10,000. This will be covered in another section.]
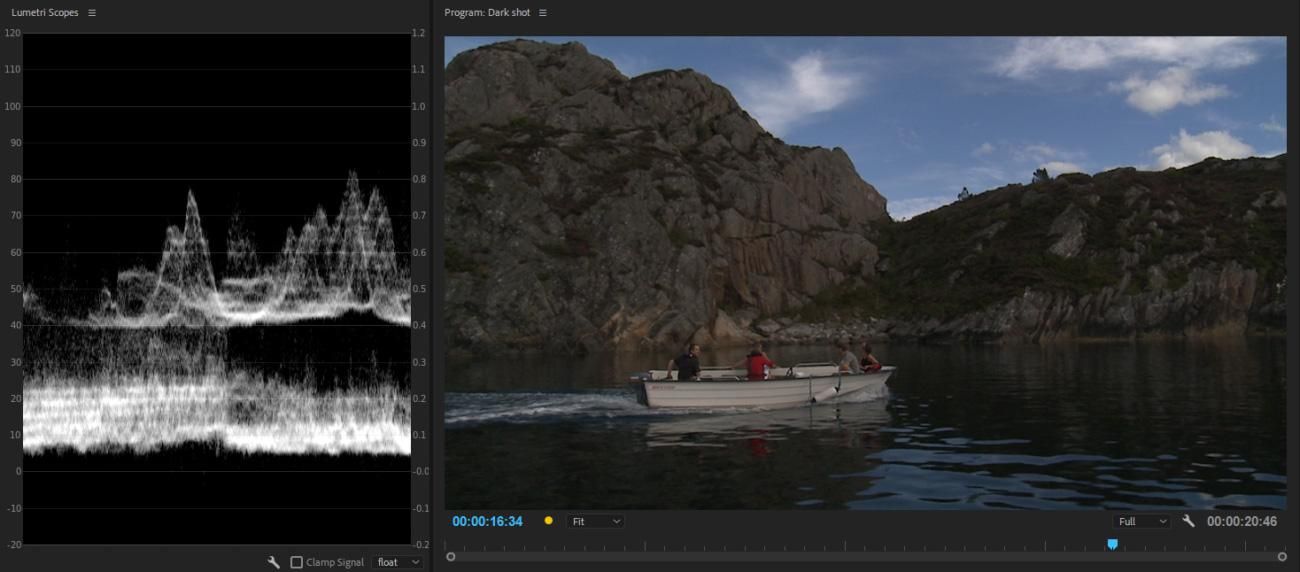
Waveform Scope for an underexposed shot
In this underexposed shot, we can see that the the brightest area of the image peaks at around 80 on the scope. Remember, “brightest” means “closest to absolute white.” For this shot, that is the clouds. However, since the signal at those points only reads 80, it means the clouds will not be fully white. The darkest part is around 5 on the scope, which means no part of it is fully black either. So, the scope tells us that nothing is being clipped. This is really good information that will help correct the exposure.
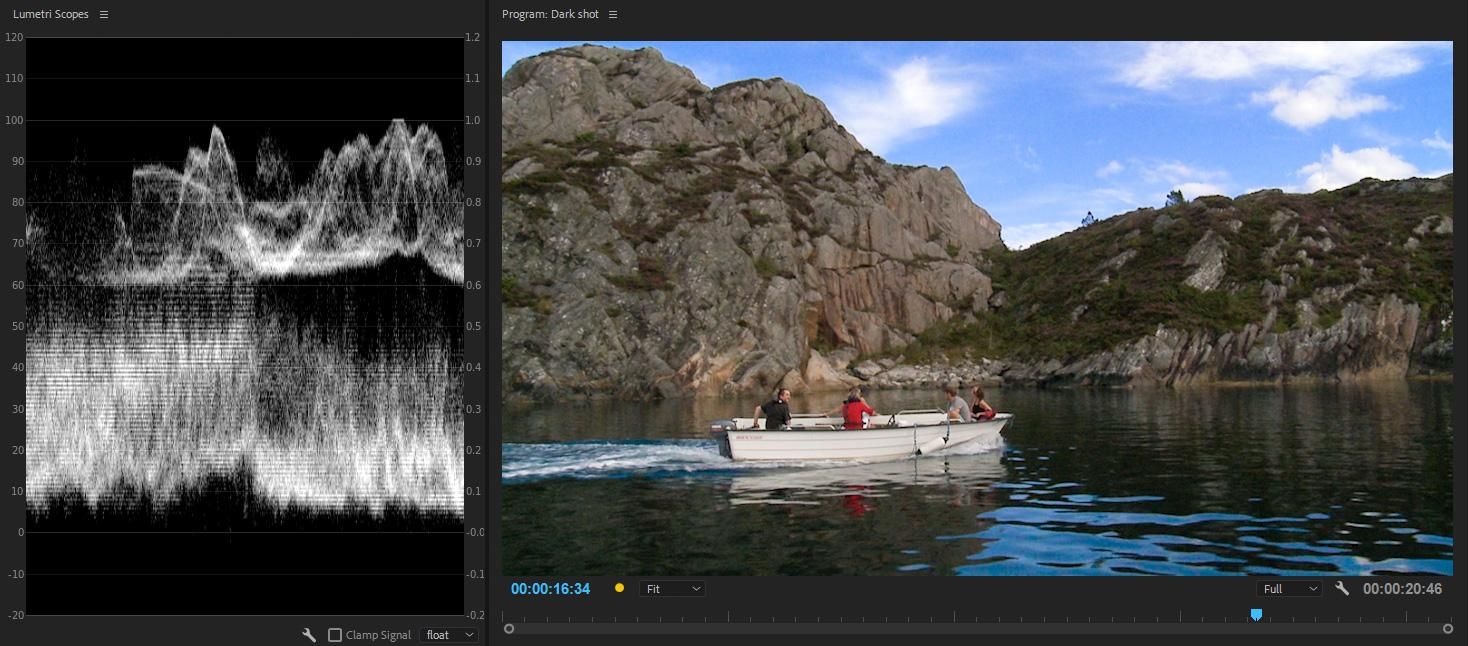
Waveform Scope after the shot is corrected
By raising the white levels, slightly lowering the blacks, and making the midtones a lot brighter, the image looks a lot better. The biggest difference before and after correction is that the midtones and shadows are spread over a larger range in the waveform. This gives the image much more contrast, and brings out details we couldn’t see before.
Of course, not every image will have exposure that stretches perfectly from 0 to 100. That said, using a Luma Waveform to correct exposure is usually the first step in the coloring process.
But it’s called color correction for a reason. We need scopes that tell us about the chroma in our images.
Well, the simplest scope that displays color information is the YC Waveform. This scopes displays both luma and chroma information of a video signal, where the two parts are overlaid and shown in different colors.
The YC Waveform Scope shows the chroma signal (blue) as an overlay on the luminance signal (green).
However, this is not the most useful scope, and you’ll probably use the chroma overlay much less often than other, more useful scopes.
The better solution for viewing chroma information on a scope is the RGB Waveform. This scope is almost identical to the luma waveform, but it breaks down an image into the three primary chroma channels, not just the luma.
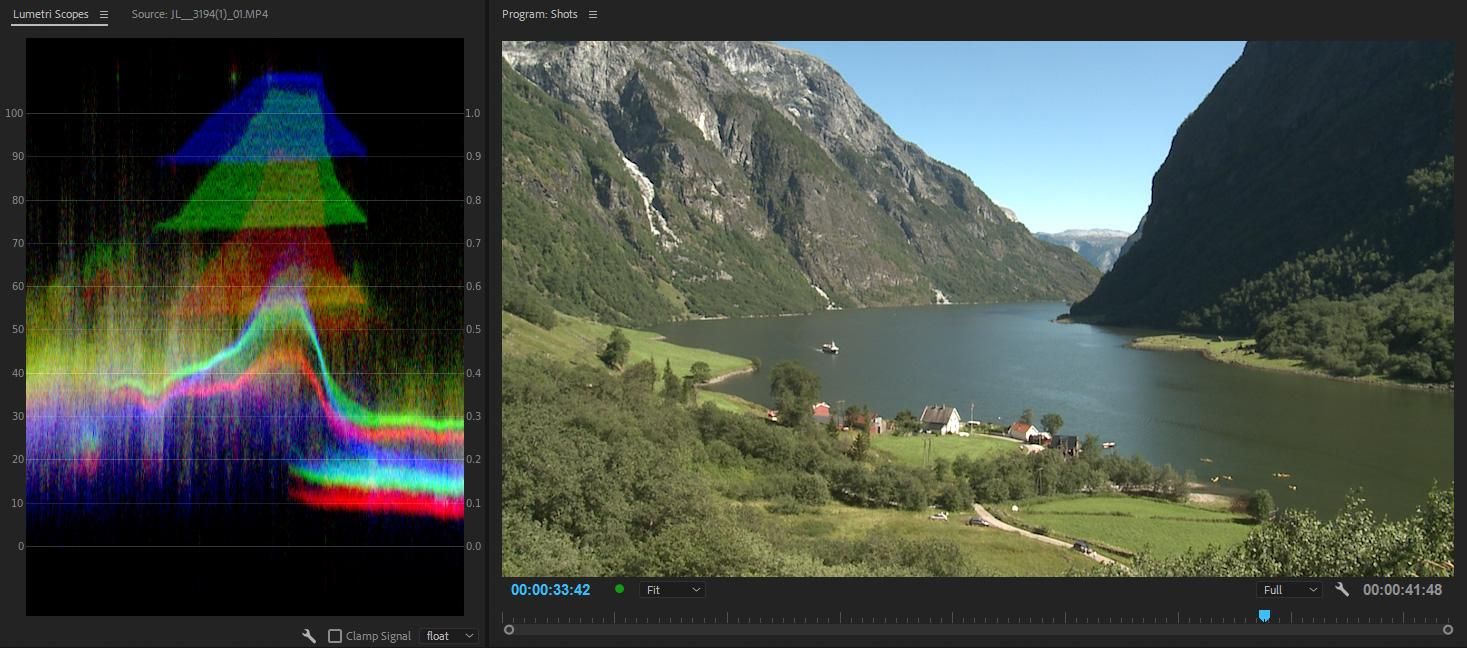
Here, we can clearly see that the dark pixels on the right have a lot higher levels in green than in red and blue. And the area with bright pixels in the middle clearly has mostly blue, but also some green – and very little red, compared.
Now we see that this image has more blue and green than red. The blue and green pixels are at about the same level, creating a cyan area above the red area in the scope.
The RGB Waveform clearly shows that the darkest areas are pretty neutral, creating a white stripe at the bottom of the waveform. Plus, it also shows that the brightest pixels have a lot more red than green, and even less blue – so it’s an orange color.
The RGB waveform is very helpful for identifying color casts in an image, and neutralizing them.
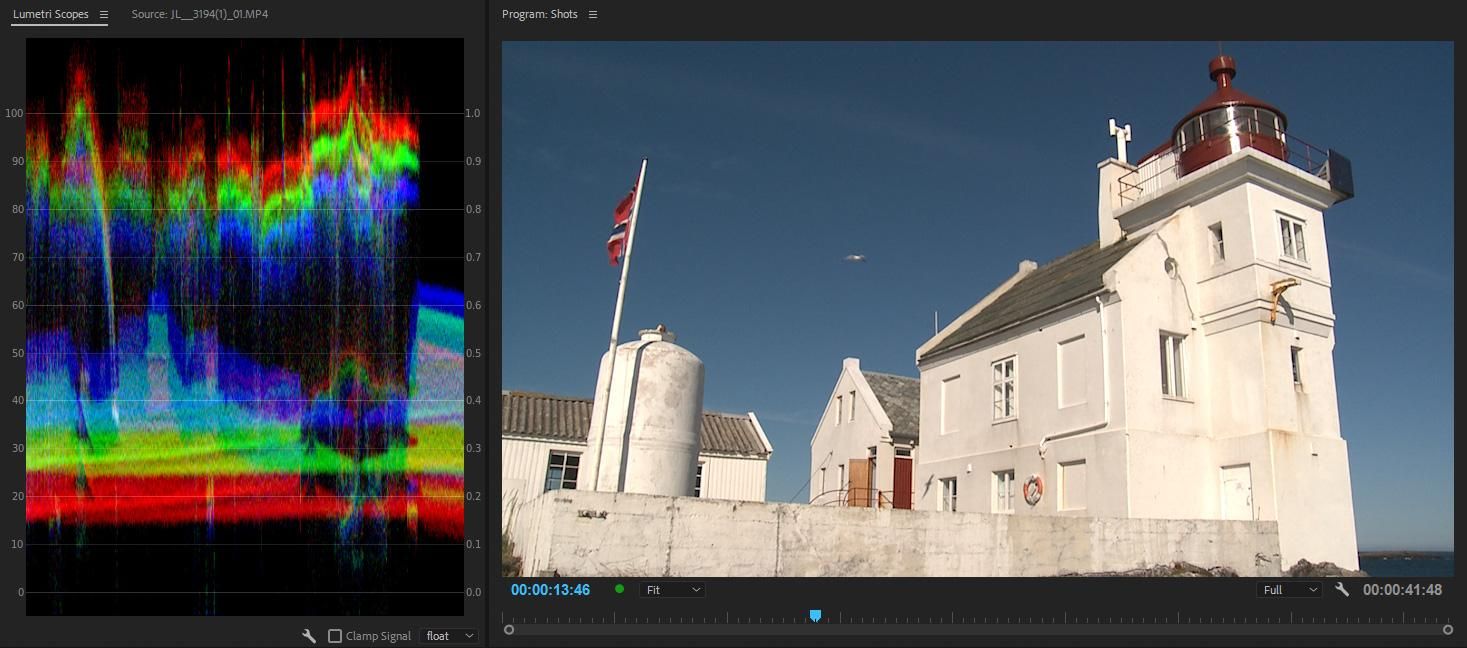
Red, green and blue bands show that there are unequal amounts of the three colors.
In this image, the lighthouse is a bit warm, as you can clearly see in the scope. There are distinct bands of red, green and blue in the brightest part of the image (the white walls).
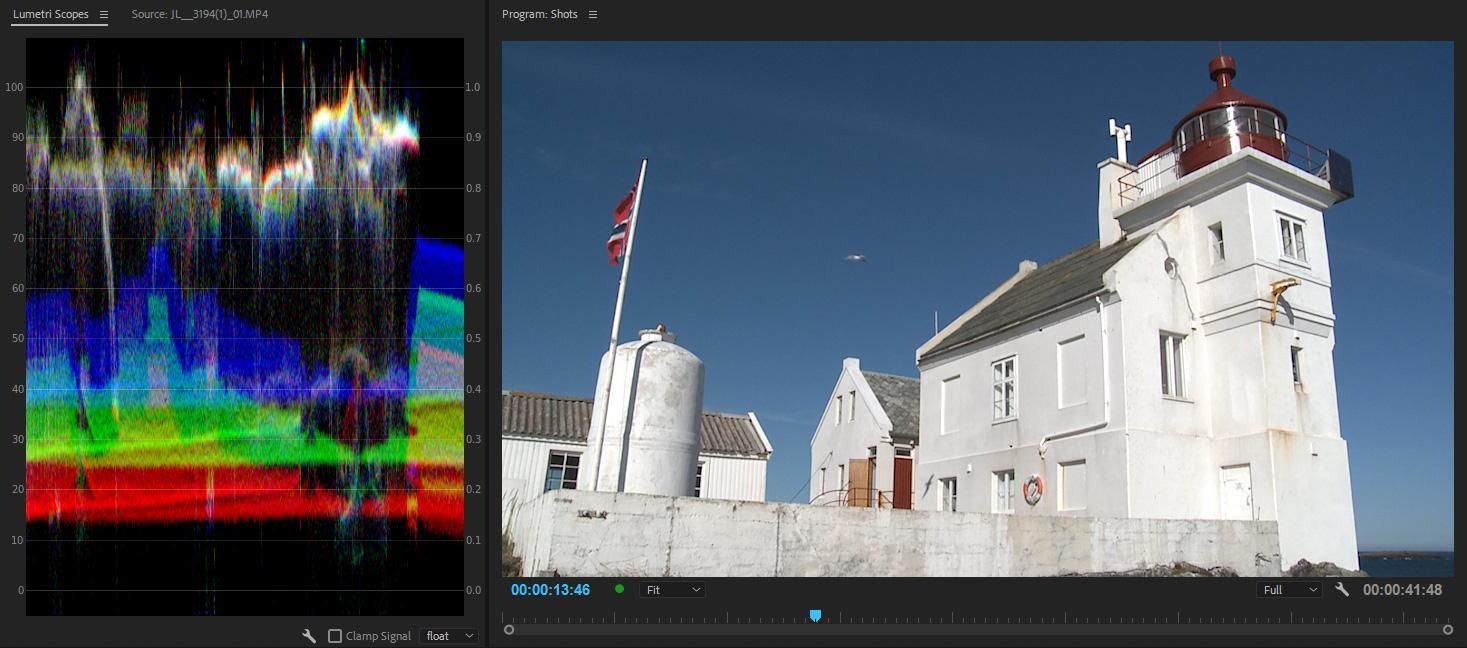
When the bands overlap and show as white, the walls are neutral.
This is easily corrected by adjusting the adjusting the color channels in the top tonal range so that the distinct bands overlap. Now that they have been corrected, they form a white streak in the top of the waveform.
RGB Parade
As useful as the RGB Waveform is, it can be confusing to differentiate the three color channels in a single scope. This is where the RGB parade comes in handy. This scope arranges the waveform for the three color channels side by side, rather than stacking them on top of each other. With it, you’ll be able to much more precisely balance your image’s color.
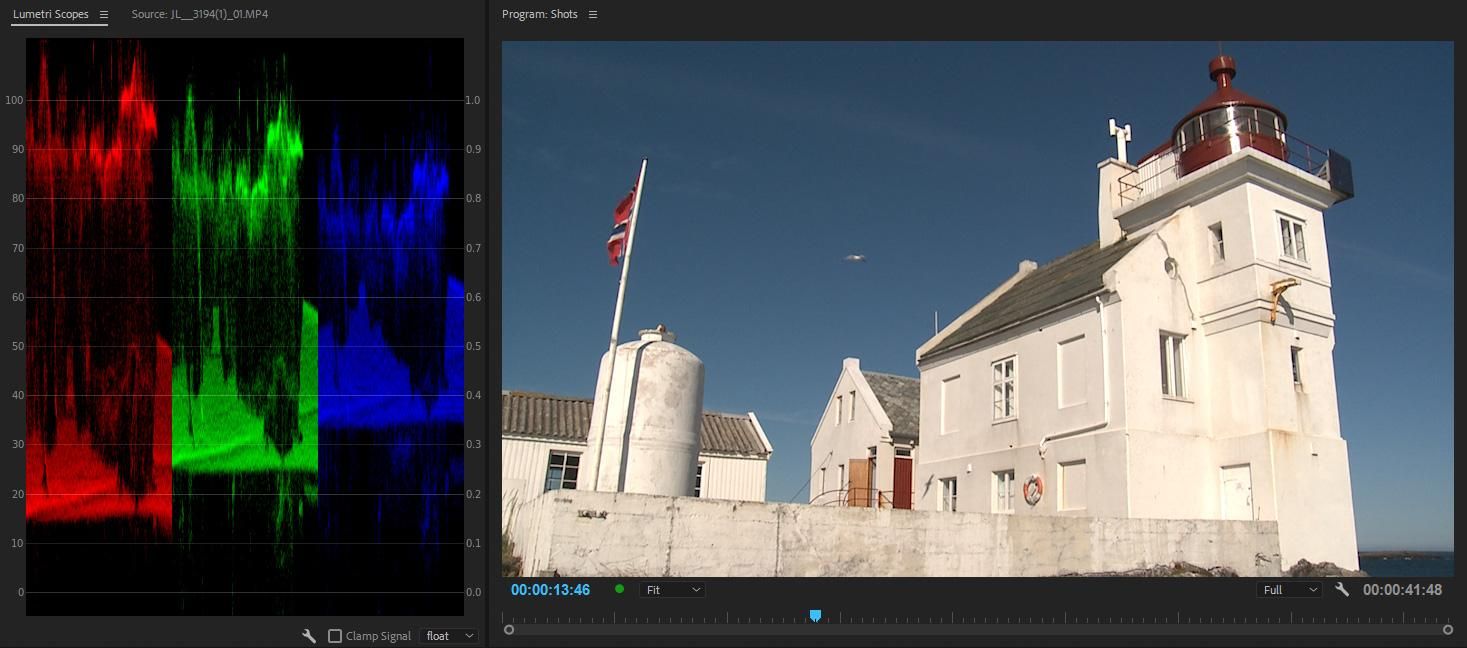
The same light house image, and in the RGB Parade Scope we can still clearly see that the highlights have more red and green than blue, so they’re warm. We can also see that the midtones have a lot more blue than green and red, making the sky blue-cyan.
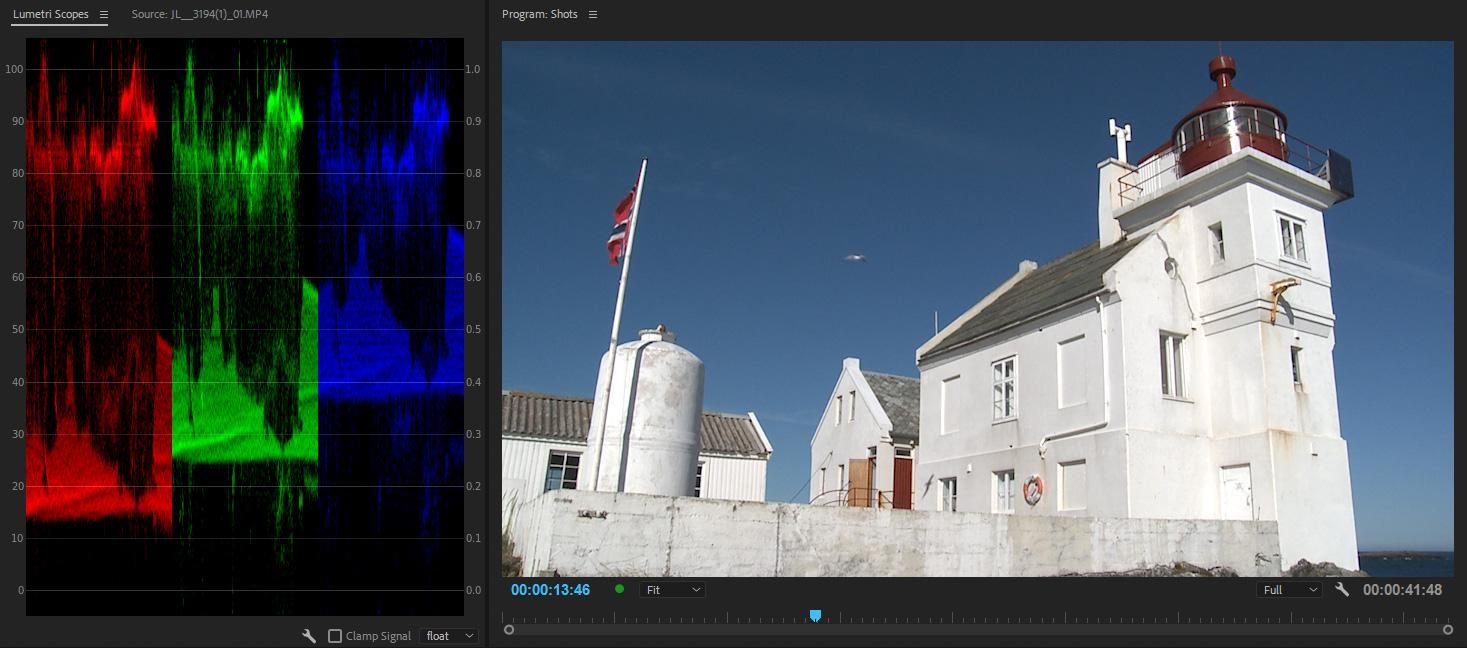
After correction, we see that the highlights are pretty much equal, making them neutral, and the midtones have more blue and a bit less red, making the sky a deeper blue.
The RGB Parade scope is easily one of the most useful scopes, as it allows you to quickly spot color balance issues. This is corresponds very well to the RGB Curves, which is able to quickly correct color balance issues. They’re a very good pair to use together.
In the above image of the lighthouse, the color imbalance can easily be fixed by dragging the upper point in the curve for each of the three primary color channels. This is a very quick method. Adjusting the blue curve only affects the blue waveform, the red curve only affects the red waveform, and so on. It is an intuitive way to balance color. Too much red in the highlights? Drag the top of the red curve down. Not enough blue in the shadows? Drag the bottom of the blue curve up. It’s really that simple.
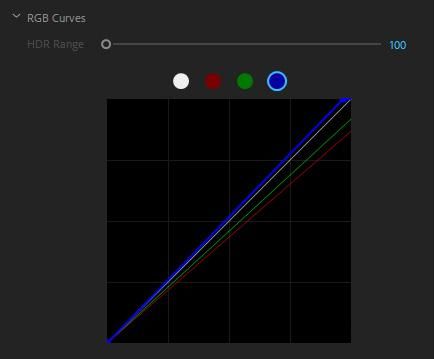
The RGB Curves adjustment needed to raise blues, and lower greens and reds. This screenshot is from the Lumetri Color Panel in Premiere Pro.
As you can see, the various flavors of waveform are very useful for evaluating your image and determining what needs to be corrected. They give you a quick, clear representation of what your image looks like, and which parts of the image need work. The Luma Waveform and the RGB Parade will be some of the most valuable tools available for color correcting your project.
Histogram
The Histogram will probably look familiar to anyone who has worked with almost any sort of camera or image editing software. A histogram displays the distribution of dark and bright pixels in an image, but (unlike the waveform) does not tell you where those pixels are in the image. This makes it a bit less useful than the Waveform Scopes when color correcting video, but can be useful in certain scenarios.
With separate red, green and blue histograms, you get more info on the levels of each color.
For example, this histogram (in Premiere Pro) shows the minimum black and maximum white levels as numbers for each color in the image. This allows you to quickly identify peaks that may escape your eyes in the Waveform Scopes (because the peaks are too small to see).
This makes histogram a useful tool for evaluating exposure, color balance, and illegal luma levels. Just like waveforms, histograms can display the luma signal by itself, or separate the chroma signal into individual scopes for red, green and blue. Some histogram run vertically, some run horizontally, but they work the same way. The trace measures the volume of pixels at each luma/chroma level from darkest to lightest.
Vector Scopes
The last scope you will use most frequently is the Vector Scope, specifically the YC Vector Scope. Vector Scopes measure the hue and saturation of colors in an image. The trace is drawn within in a circle, with the distance from the center indicating the saturation of a given color. The further from the center, the more saturated the color. The center of the scope indicates white (no chroma data), so if you only see a single dot in the middle of the scope, that’s a black and white image.
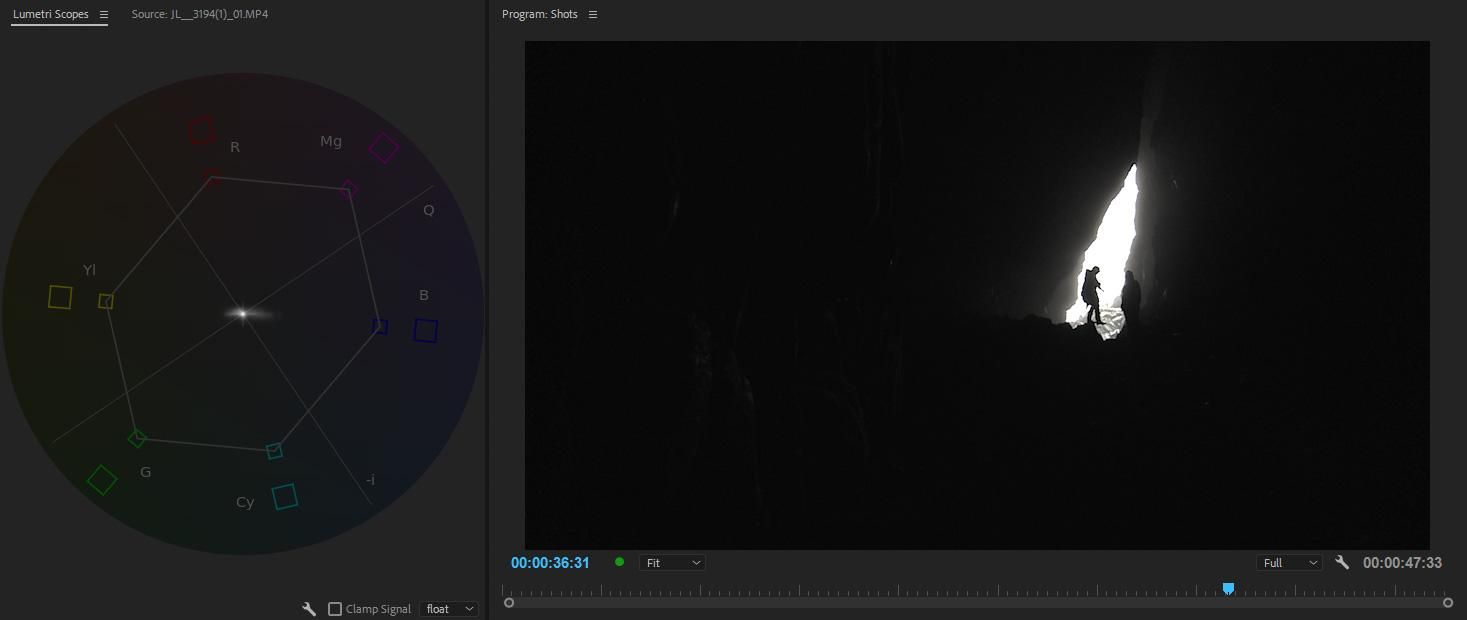
An image with very little color creates a small dot in the middle of the Vector Scope.
The angle of the trace indicates what hue the pixels in the image are. The brighter the trace is at a particular angle, the more pixels in the image are that hue.
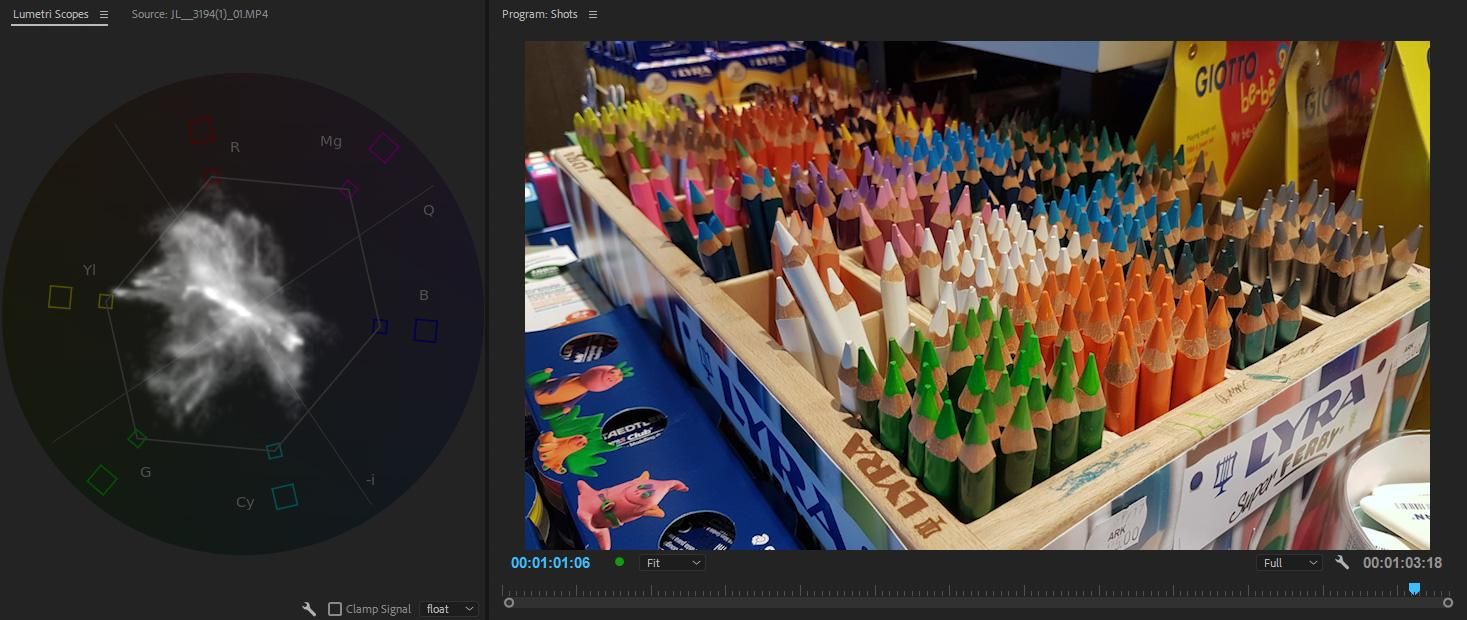
The saturated colors of the colored pencils make the trace go wide, and because there are so many different colors, it’s spreading in many directions.
As we can see in the above image of the colored pencils, the variety of vivid hues on screen makes the trace stretch toward several different color targets. The trace does not correspond to the location of these pixels in the image, just their chroma information.
This makes vector scopes the best way to spot oversaturated (illegal) color in an image. You don’t have read any other information in the trace, just what colors are present.
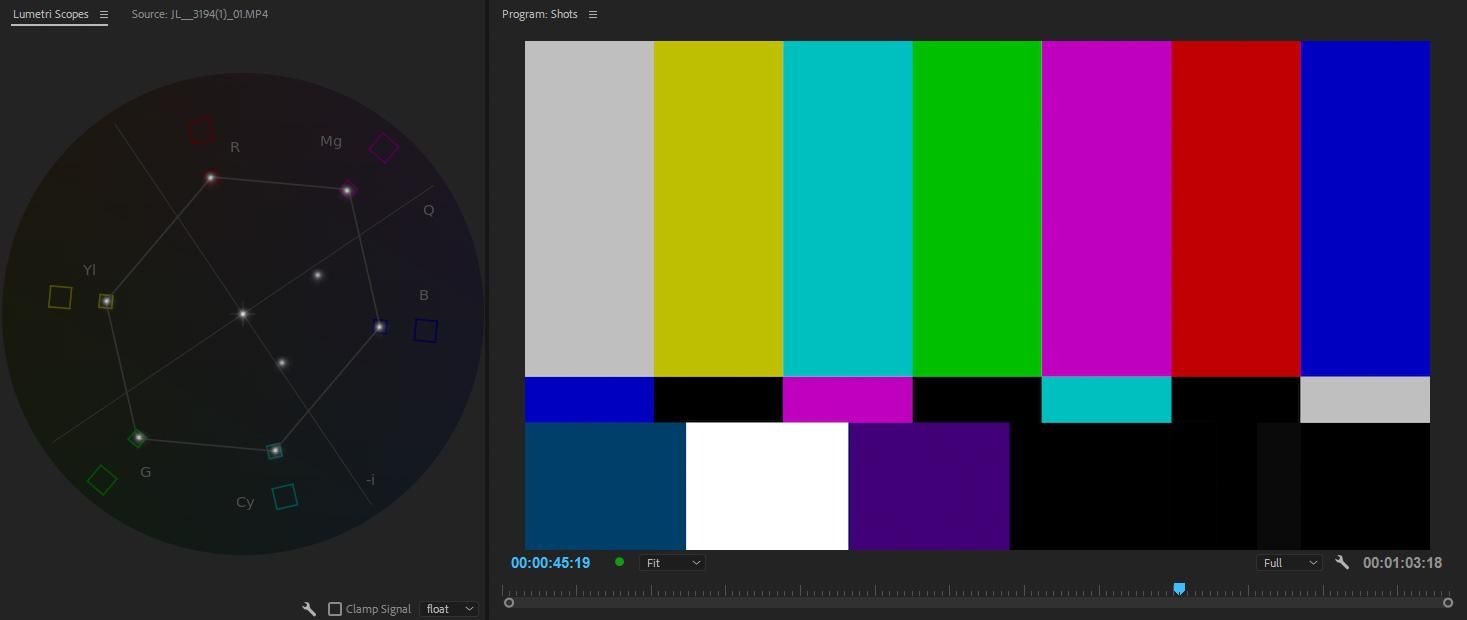
The trace from a colorbar will show dots in the inner boxes. The two dots that are not in a box are the two colors in the lower row.
The classic color bars produce a signal with the maximum-allowed saturation for each of the hues. The trace it produces clearly illustrates the limits for broadcast safe color, as shown in the color targets (represented by the boxes surrounding the center). Each one is labeled for their hue—B for Blue, R for Red, Yl for Yellow, Cy for Cyan, etc.
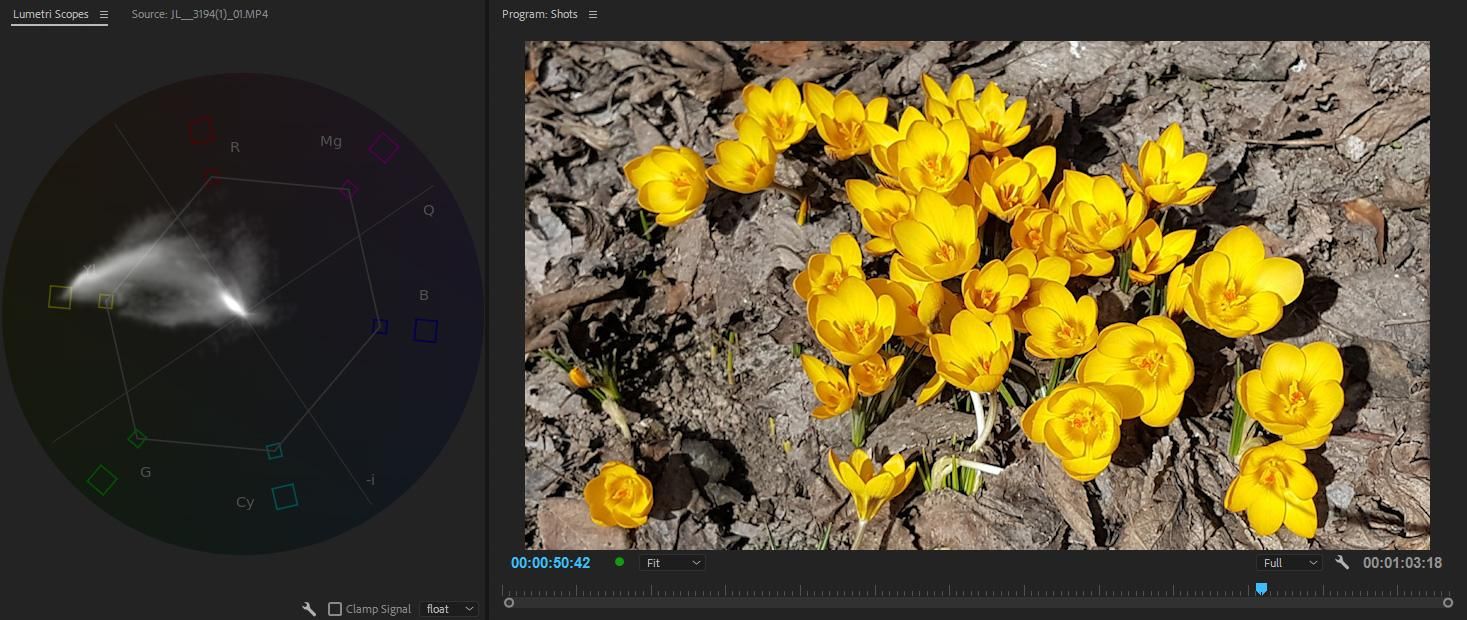
There’s a lot of yellow in this image, so the Vector Scope lights up in that direction. Since the trace goes outside the lines between the boxes, this image will be rejected by some broadcasters. The yellows need to be desaturated.
Any chroma signal that goes beyond these boxes (or the lines that connect them) is considered illegal, and so should be desaturated to meet the standards.
But vector scopes are also very useful in other ways. They are a great tool for making sure your skin tones are accurate. There is a line, extending from the center to the midpoint between the red and yellow targets, where the “ideal” hues for skin tone are found. If you want the onscreen talent to look healthy, make sure the hues of their skin fall as close to the line as possible.
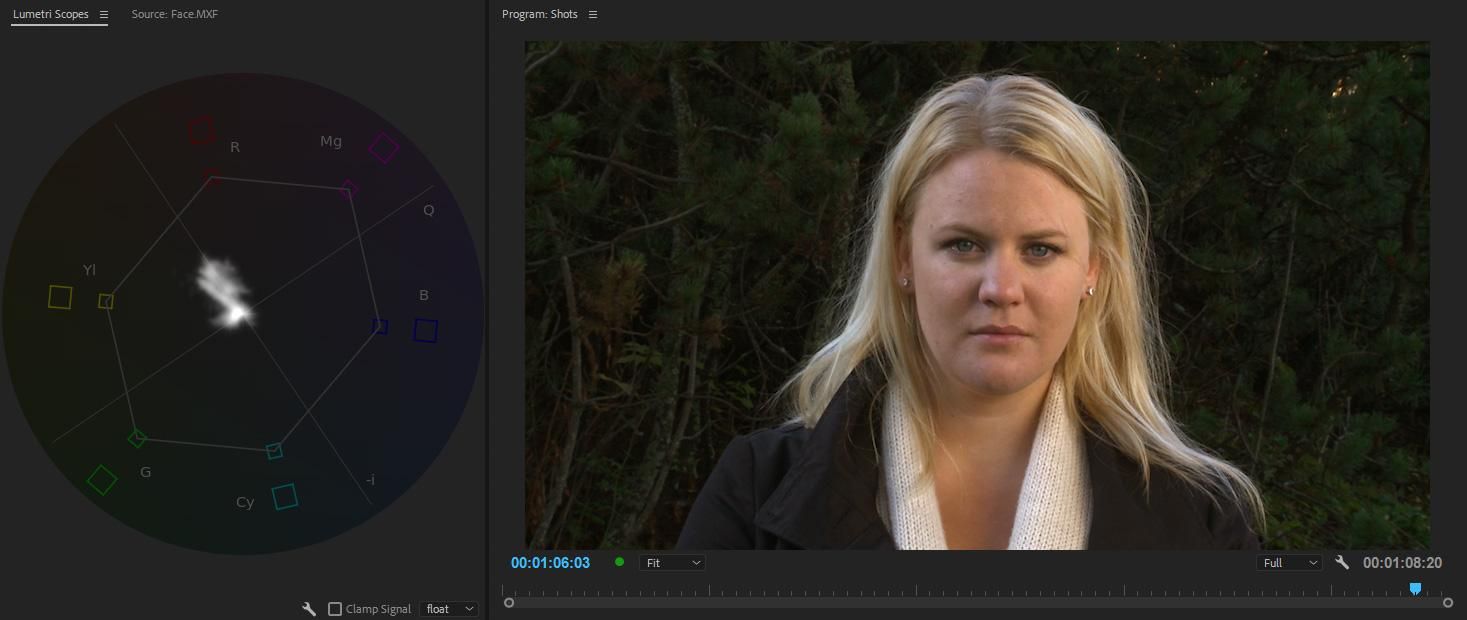
Footage courtesy of Sean Fulton and Martin Fotland. Model: Marianne Melau.
So a vector scope can be a much more clinical tool than waveforms and histograms. It allows you to rapidly check your image for certain color values, and then make adjustments based on predetermined technical standards.
Other Scopes
Once you’ve mastered using these scopes, you’re bound to discover more hiding within the menus and panels of your NLE or color correction application. Many of these scopes will likely be specialized tools for video engineers or network quality control technicians. The average editor or colorist will not find them as useful for creative work. However, now that you know how to read the most common video scopes, you should be able to handle the many derivations that exist.
Continue readingfor free
Unlock all 100,000 words of the Frame.io Workflow Guide and learn how the pros do workflow.
