Color
Digital Color
5 minute read
We’ve talked a lot about color so far. This is a very complex topic, and there are so many facets that it’s easy to get confused. So, here is a systematic recap of digital color that should help clarify what we’re talking about.
Color
Color is a term that describes the human perception of different wavelengths of light. Our eyes contain one type of cell (rods) that is sensitive to light intensity (brightness), and three different types of cells (cones) that are sensitive to certain ranges of wavelengths (colors). Cones are sensitive to long (red), medium (green), and short (blue) wavelengths.
Of course, there is an infinite number of colors in the visible spectrum, and each of these wavelength ranges produces a multitude of colors beyond just red, green, and blue. Our brains represent these other colors by blending signals between wavelengths. These are how we “see” secondary hues like yellow, magenta, cyan, and every other color.
But our eyes can’t actually differentiate the infinite number of possible colors. Based on real-world experiments, it’s estimated that our brains can only differentiate around 10 million colors. This collection of colors is called the spectrum locus, and it represents all the colors an average person can see with their eyes.
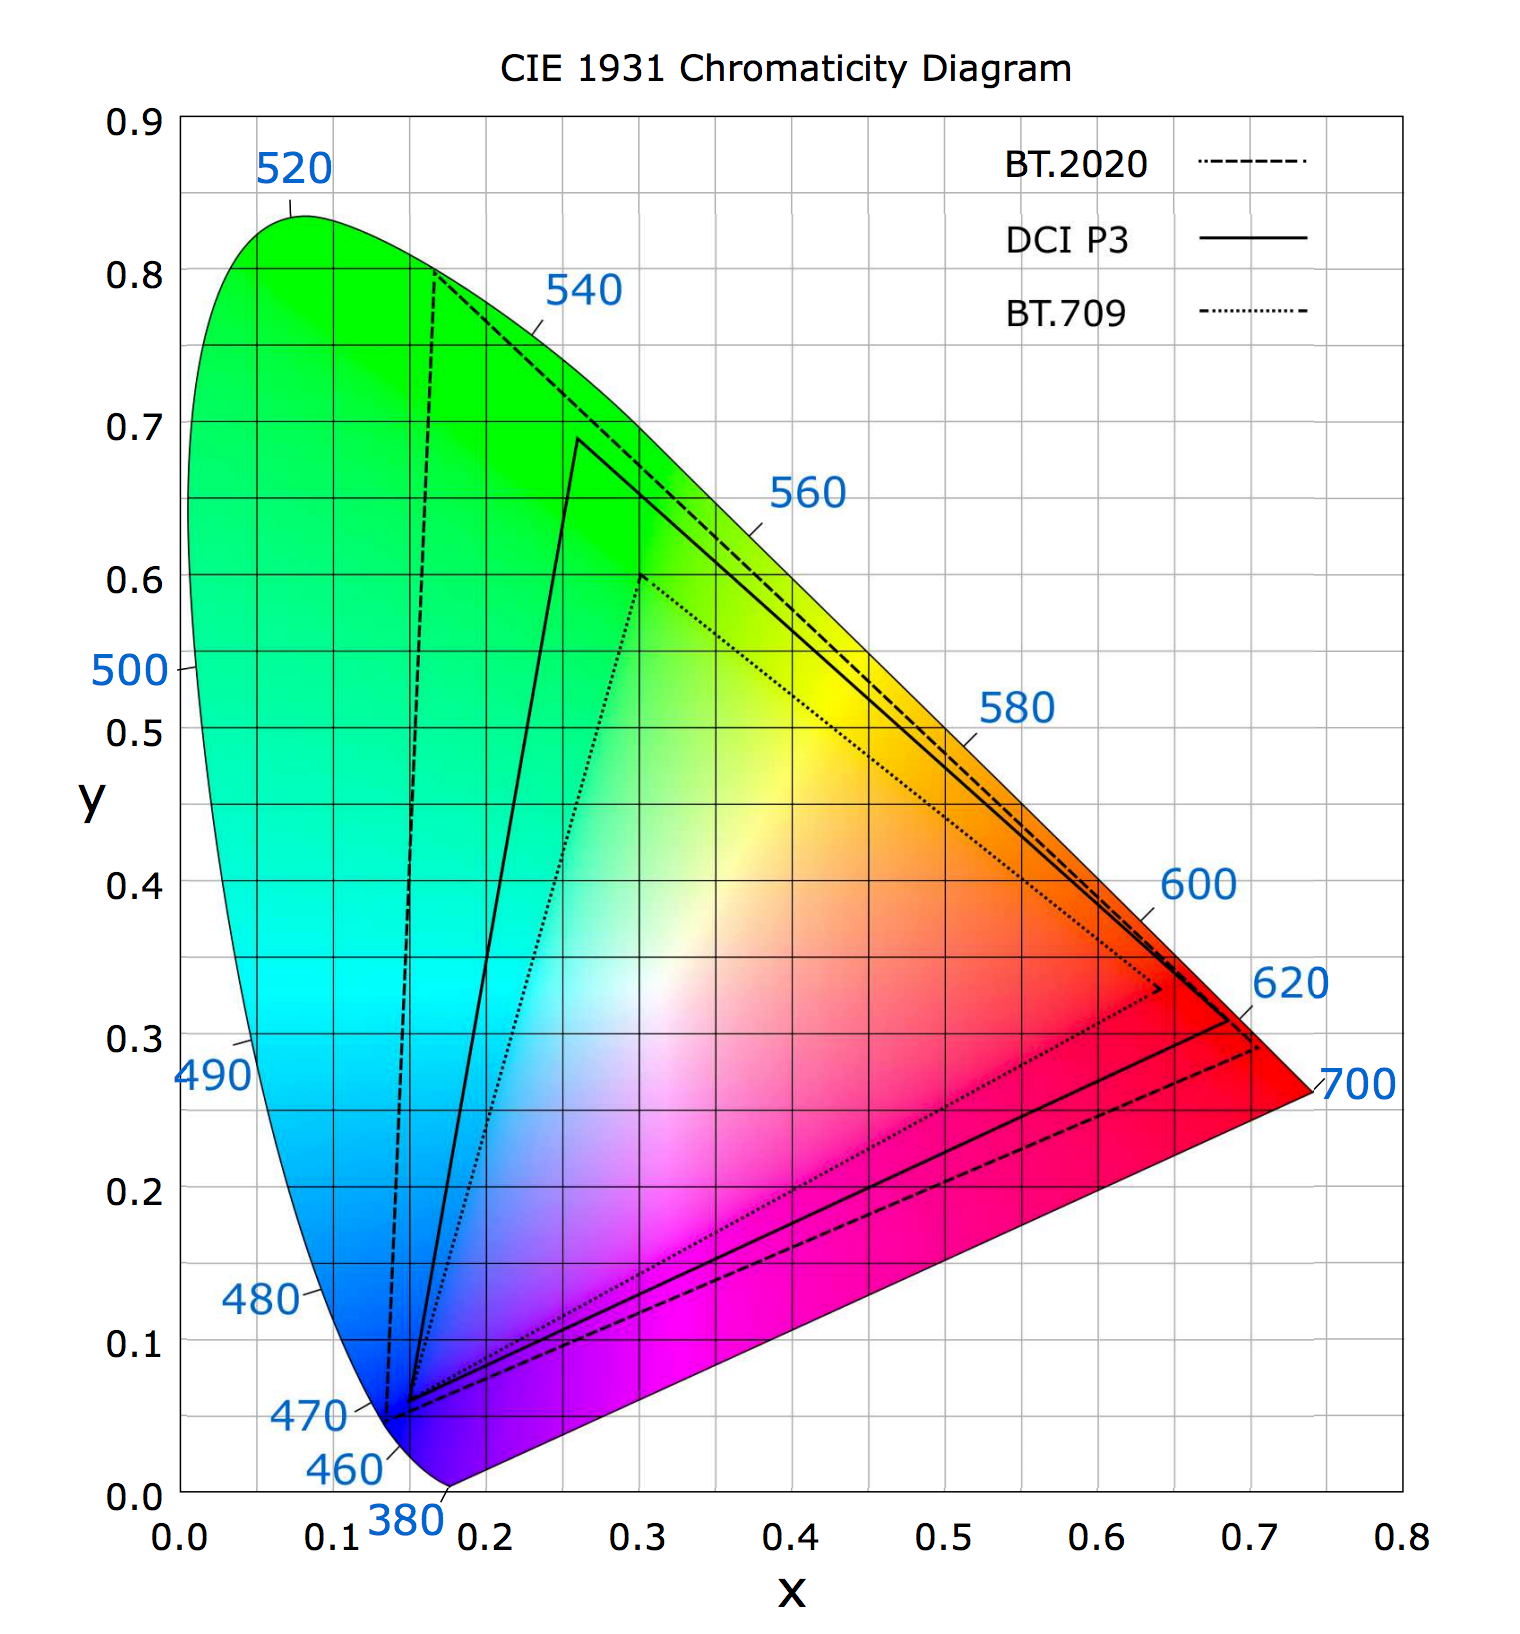
These colors have been plotted onto a graph to form the CIE 1931 Chromaticity Diagram. This is the foundation from which digital color is built. Think of it as a map, where every perceivable color can be found.
But why are the colors plotted like this? In order to make this map, we needed a system for assigning locations to colors. And for that, we used a color model.
Color Models
A Color Model is a mathematical method for describing a color based on its component properties. The standard color model for digital video is the RGB color model, which is the same model the CIE 1931 diagram uses. This color model describes every color based on the amount of red, green, and blue light that combines to create it. Why red, green, and blue? Because our biological vision system is based on those wavelengths.
But remember, we have a problem with digital color. Our machines don’t have eyeballs. To represent colors on digital machines, we need a way of counting them, because humans and machines can agree on mathematical values. So, if every color has a countable value, then we can tell our machines what to call different colors. That way, when we ask a machine for a particular color (by its countable value/name) the machine will give us what we want.
This is what the RGB color model enables. It plots colors based on their component parts—the amount of red, green, and blue that make it up. Mathematically, we can calculate these amounts as three percentage values. This group of three values is called an RGP Triple, and it’s basically the location of a digital color on the map of the perceivable spectrum.
But if you tell a computer that a color is 25% red, 75% green, and 58.935% blue, it won’t be able to make those calculations without more information. It needs to know what red, green, and blue points on the map it is supposed to calculate from, otherwise the percentage is meaningless. 25% of which red, or 75% of which green? Different primary color points will result in different outputs. To standardize the results, we need to tell machines which points to use, and we do that by assigning a color space to the image.
This is why, when you see color space diagrams like the one above, a color space is always a perfect triangle—it represents all of the values between three points.
Color Space
A Color Space is a specific organization of colors. It sets the location for the three primary colors, that is the points on the map that equal 100% of red, green, and blue. Once a computer knows the primary color points it’s supposed to use, it’s quite easy to find every other color relative to them.
Now you might wonder why computers don’t just utilize the points on the CIE 1931 color diagram. It is a color space, after all. Unfortunately, there are no machines that can actually display the total extent of the colors on the chart. It’s just not possible yet with our current technology. So, in order to make it easier to use color digitally, we need primary color points that machines can actually handle.
The standard color space for most video is the Rec. 709 color space. It’s a fairly small color space, but it has been the standard for SDR content for many years. As we move into the future of 4K HDR content, the larger Rec. 2020 color space will become the norm. There are also different color spaces for specific technical applications, like DCI-P3 for cinema projection.
The three triangles in this image represent those three color spaces. The curving shape that goes beyond them represents all of the colors that humans can perceive.
Each of the different color spaces has advantages and disadvantages, and comparing them is not always straightforward. One of the most important ways to compare them, however, is by comparing their color Gamuts.
Color Gamut
A Color Gamut is just the footprint of a color space. It is the subset of possible colors that a machine has to choose from within a particular color space. If you take a color model and add a color gamut, you make a color space, which digital machines can understand. Generally speaking, a color space with a larger footprint is said to have a wider gamut.
It should be noted that a gamut is just the extent of colors that can be reproduced in a color model. It is not the number of colors that an image can contain. To make that measurement, we need to understand Color Depth.
Color Depth
Color Depth, also known as bit depth, is a measurement of the number of possible colors in an image. It is determined by the amount of digital information used to describe every color. More bits of information allows for more possible colors to be described.
But color depth does not tell us which colors from what color space are in an image. To continue the earlier analogy, if a color model is the map, and the color space dictates the addresses of every color, then an image’s color depth determines how many addresses there are between each of the reference points (primary color points). So, it’s sort of like the resolution of the map.
Continue readingfor free
Unlock all 100,000 words of the Frame.io Workflow Guide and learn how the pros do workflow.
